728x90

Metrics 8

Grafana alert or 조건 사용

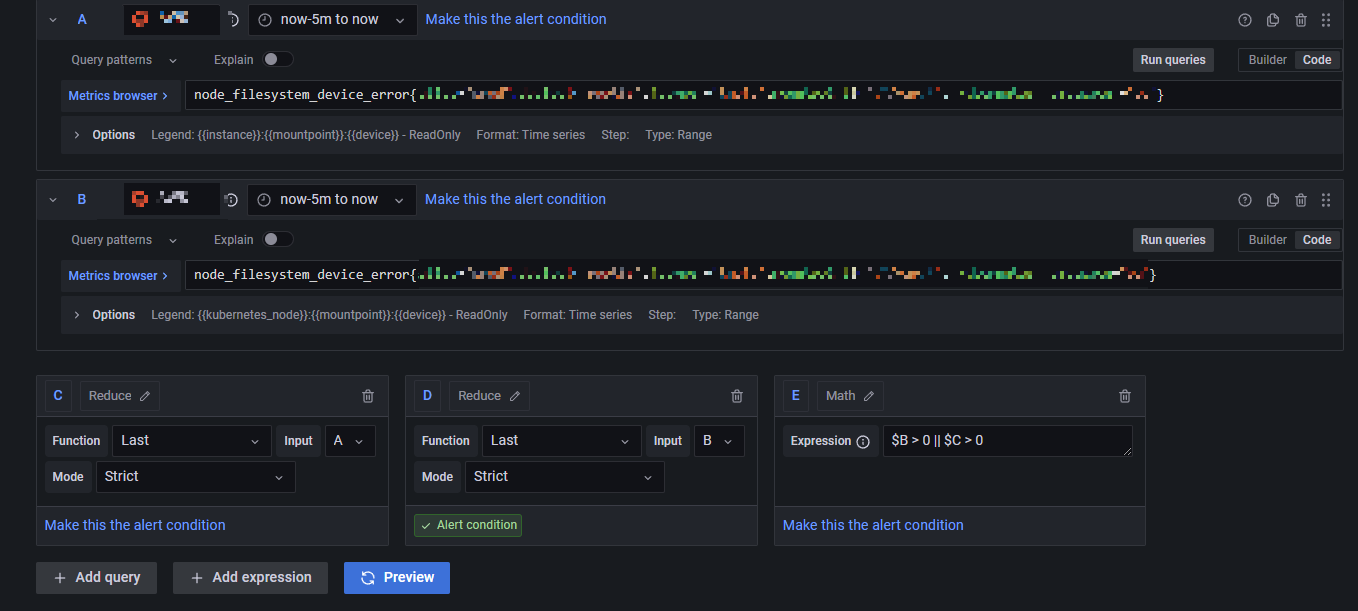
Grafana에서 Alert 설정하는 부분을 확인하고 싶다면 아래 링크를 확인하시길 바란다. https://babbeolicoding.tistory.com/27 Grafana Alert 설정하기-2(Alert 조건 설정) 1. Datasource 선택 및 Query 작성 Reduce -> 각 인스턴스 하나하나 개별로 검토 Math -> 각 인스턴스의 결과값으로 조건 확인 A => 쿼리 B => 쿼리에서 나오는 인스턴스 각각의 결과값 C => 각 인스턴스의 결 babbeolicoding.tistory.com 보통 Alert에서 or 조건문을 사용할 땐 마지막 조건문 Math 부분에 "$B > 0 || $C > 0" 이렇게 조건을 넣는다. 어느날 or 조건을 세팅하고 있었는데 자꾸 Math에서 조건문에 No..

prometheus rate irate 차이점 비교

grafana에서 metrics을 가져올 때 rate 함수를 써야 할지 irate 함수를 써야 할지 고민이라면 아래 그래프와 설명을 보고 해당 환경에 맞게 선택하면 된다. 맨 밑에 적어놓은 설명은 한 번씩 읽어보시면 될 것 같고 간단하게 얘기하자면 아래 그래프에서 보듯이 변동성이 심한 부분은 irate 함수를 사용한 그래프고 변동성이 적은 부분은 rate 함수를 사용한 모습이다. 자세한 내용은 아래 글을 참고하시길 바란다. rate() rate(v range-vector)범위 벡터에서 시계열의 초당 평균 증가율을 계산합니다. 단조로움의 중단(예: 대상 재시작으로 인한 카운터 재설정)은 자동으로 조정됩니다. 또한 계산은 시간 범위의 끝까지 외삽하므로 누락된 스크랩 또는 스크랩 주기가 범위의 기간과 불완전하..

통합 Prometheus federate 옵션 사용 시 metrics 보관 주기

통합 Prometheus federate 옵션을 사용해서 모니터링 시스템을 구축했을 때 metrics 보관 주기를 효율적으로 설정하는 방법이 있다. 통합 Prometheus federate 옵션으로 여러 개의 Prometheus를 한 곳의 Datasource로 모아서 구현하는 방법이 궁금하다면 글을 읽고 오시기 바란다. https://babbeolicoding.tistory.com/59 통합 Prometheus federate 옵션 Prometheus가 많아질수록 Datasource도 점점 많아진다. Datasource가 많아지면 Grafana에서 metrics 조회 쿼리를 작성할 경우 조건에 따라 매번 다른 Datasource를 선택해줘야 하기 때문에 굉장히 번거롭다. 이런 babbeolicoding...

Grafana Alert 설정하기-4(No Data Alert 설정)

Grafana에서 Alert을 설정할때 아래 이미지처럼 "No data"로 metrics이 수집이 안되는 경우 보통 Alert이 날아간다. 하지만 경우에 따라 No data인 경우가 정상이고 metrics이 수집되는 경우 비정상인 경우도 필요하다. 이런 경우는 Alert을 설정할때 Configure no data and error handing 부분을 설정해주면 No data인 경우도 Alert을 보내지 않을 수 있다. Alert을 설정할때 Configure no data and error handing 부분을 클릭하면 Alert state if no data or all values are null 부분이 보통 No Data로 되어있다. 이 설정은 metrics이 아무것도 수집되지 않는 경우 즉 No ..

Windows exporter 설치 옵션

1. 설치파일 다운로드https://github.com/prometheus-community/windows_exporter/releases 접속 후 다운로드그냥 설치를 하려면 아래 링크를 보고 설치 https://babbeolicoding.tistory.com/17 Windows exporter 설치1. 설치파일 다운로드 아래 링크로 접속 후 환경에 맞는 버전을 다운로드 https://github.com/prometheus-community/windows_exporter/releases 2. 다운로드 받은 파일 설치 진행 3. 서비스 확인 - windows_exporter라는 이babbeolicoding.tistory.com 하지만 아래 사이트를 보면 추가적으로 metrics을 수집하기 위해 옵션을 줘야..

Prometheus Node_exporter 연동

1. prometheus.yml 수정 prometheus.yml에 node_exporter를 설치한 서버의 정보를 입력 sudo vi /etc/prometheus/prometheus.yml jobname : node_exporter targets : node_exporter server IP : 9100 2. prometheus 재기동 - yml을 수정하면 prometheus 재기동이 필요함 sudo systemctl restart prometheus 3. Prometheus에 추가한 instance 확인 아래 이미지처럼 metrics 수집 시 instance와 job에 추가한 서버가 나오는지 확인

node_exporter 설치

1. 파일 다운로드 sudo wget https://github.com/prometheus/node_exporter/releases/download/v1.2.2/node_exporter-1.2.2.linux-amd64.tar.gz 2. 압축 해제, 파일 이동 - 압축해제 : sudo tar -xvf node_exporter-1.2.2.linux-amd64.tar.gz - 파일이동 : sudo mv node_exporter-1.2.2.linux-amd64/node_exporter /usr/local/bin/ 3. 서비스 등록(사용자 추가, 서비스 파일 등록) 사용자 추가 : sudo useradd -rs /bin/false node_exporter 서비스 파일 등록 : sudo vi /etc/systemd..

728x90